Making Analytics Accessible Through Augmented Analytics

Understanding Augmented Analytics and Its Importance
Augmented analytics represents a significant shift in how we interpret data. By utilizing advanced technologies like machine learning and natural language processing, it empowers users to access insights without needing deep technical expertise. Imagine being able to ask a question about your sales data and receiving an insightful answer almost instantly, just like having a conversation with a knowledgeable friend.
Without data, you're just another person with an opinion.
This approach not only democratizes data access but also enhances decision-making across all levels of an organization. Businesses are increasingly realizing that analytics shouldn't be confined to data scientists or IT professionals. Instead, everyone from marketing to operations can benefit from insights derived from their everyday data.
In a world flooded with information, making analytics accessible ensures that organizations can adapt quickly and respond to market changes. Augmented analytics is like having a personal guide through the complex landscape of data, making it easier for everyone to navigate and find the insights that drive success.
The Role of Machine Learning in Augmented Analytics
Machine learning (ML) plays a crucial role in augmenting analytics by automating data preparation and analysis. This means that routine tasks, such as data cleaning or identifying trends, are handled by algorithms, allowing users to focus on interpretation and strategy. Think of it as having an assistant who takes care of the tedious tasks while you concentrate on the bigger picture.

With ML capabilities, augmented analytics tools can learn from historical data and improve the accuracy of predictions over time. For example, if a retailer uses ML to analyze customer purchasing patterns, the system can suggest personalized offers that increase conversion rates. This tailored approach not only enhances customer experience but also boosts sales.
Augmented Analytics Empowers All Users
By making data insights accessible through user-friendly tools, augmented analytics democratizes data access across all levels of an organization.
Furthermore, as these algorithms become more sophisticated, they provide deeper insights that may not be immediately apparent through traditional analytics. This ability to uncover hidden patterns is like discovering a treasure map within your data, guiding you to valuable insights that can lead to informed business decisions.
Natural Language Processing: Making Data Speak
Natural Language Processing (NLP) allows users to interact with analytics tools using everyday language. Instead of navigating complex dashboards or writing intricate queries, users can simply ask questions like, 'What were our top-selling products last month?' and receive clear, concise answers. It’s akin to chatting with a friend who happens to know everything about your business.
The goal is to turn data into information, and information into insight.
This conversational interface significantly lowers the barrier to entry for users who may feel intimidated by traditional data analytics. By making data accessible in a familiar format, organizations empower employees at all levels to engage with their data more confidently. This inclusivity fosters a culture of data-driven decision-making throughout the company.
Moreover, NLP capabilities can help bridge communication gaps between technical and non-technical teams. When everyone can understand the insights derived from data, collaboration improves, leading to better strategic alignment and more informed decisions across departments.
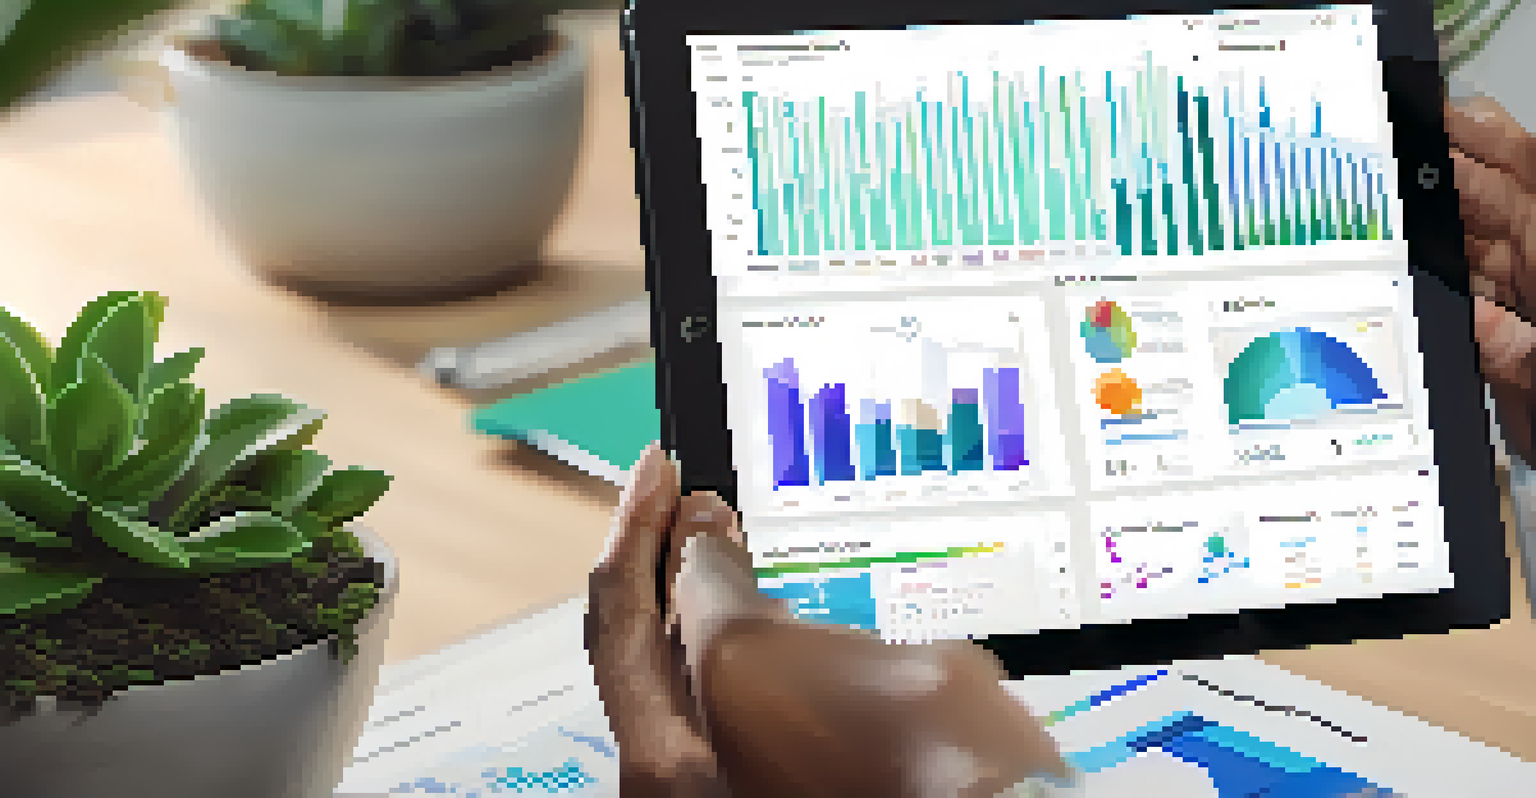
Visualizing Data: Turning Insights into Action
Effective data visualization is essential in translating complex data sets into easily digestible formats. Augmented analytics tools typically incorporate dynamic visualizations, such as charts and graphs, that help convey insights at a glance. Picture a dashboard that highlights key performance indicators in vibrant colors—it makes the information pop and captures attention immediately.
These visual tools are not just about aesthetics; they enhance the understanding of data relationships and trends. For instance, a line graph showing sales over time can quickly illustrate fluctuations in performance, enabling teams to spot seasonal trends or identify areas for improvement. Visualization turns raw data into a narrative that guides decision-making.
Machine Learning Enhances Insights
Machine learning automates data preparation and analysis, enabling deeper insights and tailored recommendations that drive better decision-making.
Additionally, interactive visualizations allow users to explore data more deeply. They can drill down into specifics, adjust parameters, and uncover insights tailored to their needs. This level of engagement transforms passive data consumption into an active exploration, empowering users to take informed actions based on real-time insights.
Empowering Business Users with Self-Service Analytics
Self-service analytics is a cornerstone of augmented analytics, enabling business users to derive insights without heavy reliance on IT. This feature is particularly beneficial in fast-paced environments where quick decisions are crucial. Imagine a marketing team being able to generate reports on campaign performance without waiting days for data requests—this agility can significantly impact their strategies.
By providing user-friendly tools that require minimal training, organizations foster a culture of data literacy. Employees can explore data on their own, leading to a more informed workforce that can contribute to strategic discussions. This empowerment encourages a proactive approach to problem-solving, as users can identify trends and issues as they arise.
Moreover, self-service analytics helps alleviate the bottleneck often created by centralized data teams. When everyone can access the insights they need, it not only speeds up decision-making but also enhances collaboration across departments. This democratization of data ultimately leads to more innovative solutions and better business outcomes.
Driving Innovation Through Augmented Analytics
Augmented analytics is a catalyst for innovation, allowing organizations to harness the power of their data in new and creative ways. By simplifying the analytics process, teams can focus on experimenting with data-driven ideas rather than getting bogged down in technical details. This shift encourages a culture of experimentation where new strategies and initiatives can flourish.
For example, a company might use augmented analytics to explore customer feedback in real-time, identifying common themes that lead to product improvements. This quick feedback loop enables businesses to adapt and innovate rapidly, helping them stay ahead of the competition. It’s like having a pulse on customer sentiment that informs continuous improvement.
Real-Time Analytics Drives Agility
The integration of real-time analytics allows organizations to make immediate, informed adjustments to strategies, enhancing their responsiveness to market changes.
Furthermore, as organizations embrace augmented analytics, they can uncover new business opportunities that were previously hidden. By analyzing diverse data sets, they may identify emerging trends or untapped markets, leading to strategic investments and growth. Ultimately, augmented analytics transforms data from a passive resource into a dynamic driver of innovation.
Future Trends in Augmented Analytics
As technology evolves, so too does the landscape of augmented analytics. Emerging trends suggest that the integration of artificial intelligence (AI) will become even more pronounced, enabling even deeper insights and more predictive capabilities. This means that future tools will not only analyze past data but also forecast future scenarios with greater accuracy.
Additionally, the rise of real-time analytics is set to revolutionize decision-making. Organizations will increasingly leverage live data streams to make immediate adjustments to their strategies, much like a pilot adjusting flight paths based on real-time weather updates. This agility will be vital in navigating the complexities of modern business.
Moreover, as more organizations recognize the value of augmented analytics, we can expect to see a greater emphasis on user experience and accessibility. Tools will continue to evolve, becoming more intuitive and tailored to the diverse needs of users. This focus on user-centric design will ensure that augmented analytics remains an essential component of data-driven decision-making.