Key Features to Look for in Data Visualization Software

User-Friendly Interface for Seamless Navigation
A user-friendly interface is vital when choosing data visualization software. It should allow users to navigate easily and intuitively, regardless of their technical skills. Imagine trying to read a map that’s cluttered and confusing; the same frustration applies to complex data tools.
Data visualization is not just a tool; it’s a way to communicate insights and tell stories with data.
Look for software that offers drag-and-drop functionality, as this will enable you to create visualizations with minimal hassle. This feature often helps users focus on the data rather than getting lost in complicated menus. A clean, organized layout can dramatically reduce the learning curve.
Moreover, consider the availability of tutorials or help resources. Good software will provide guidance, helping users to unlock its full potential without feeling overwhelmed. This support can transform a daunting task into an engaging experience.
Variety of Data Visualization Options Available
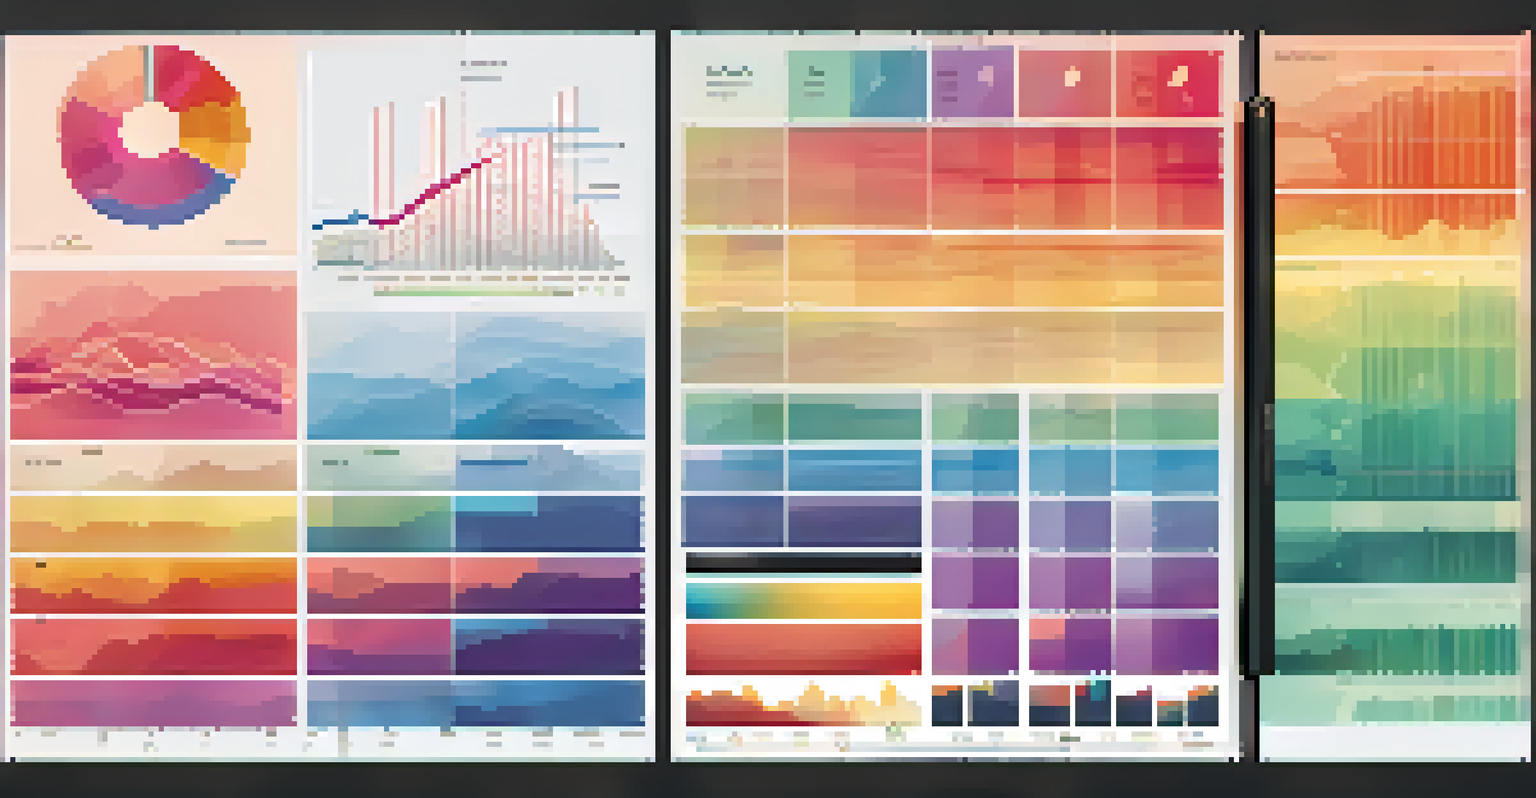
When evaluating data visualization software, a diverse array of visualization types is essential. Whether you need bar graphs, pie charts, or more complex heat maps, the software should have options to cater to your specific needs. Different data types call for different visual representations, so versatility is key.
Imagine trying to convey a trend over time with a static image; it simply won’t have the same impact as a dynamic chart. The ability to choose from various visualization formats allows you to present your data in the most effective way. It’s about telling a story with your data, and the right visuals make all the difference.
User-Friendly Interfaces Matter
A user-friendly interface enhances navigation and helps users focus on data rather than complicated menus.
Furthermore, consider whether the software allows customization of these visualizations. Tailoring colors, sizes, and labels can enhance clarity and make your data more engaging for your audience. Customization ensures your visuals align with your brand and message.
Integration with Other Tools and Platforms
Integration capabilities are a crucial feature of any data visualization software. In today’s data-driven world, you likely use multiple tools for data analysis and reporting, and seamless integration can save time and effort. Whether it’s connecting with databases, spreadsheets, or CRM systems, interoperability enhances workflow efficiency.
The goal is to turn data into information, and information into insight.
For instance, if your visualization software can pull data directly from your database, you won’t need to spend valuable time exporting and importing files. This not only streamlines the process but also reduces the risk of errors that can occur during manual data handling. Think of integration as a bridge that connects various islands of information.
Additionally, consider how well the software integrates with cloud services. This can facilitate data access from anywhere, making it easier to collaborate with team members. In a remote work environment, this flexibility is more important than ever.
Robust Data Analysis and Filtering Features
Good data visualization software should offer robust analysis and filtering features. These tools enable users to delve deeper into the data, uncovering insights that might otherwise remain hidden. Imagine sifting through a mountain of data without the ability to filter; it would feel overwhelming and unproductive.
By allowing users to apply filters or aggregations, the software helps focus on specific datasets that matter most. This is particularly useful for businesses looking to track performance metrics or customer behavior over time. Without these features, data analysis can quickly become a tedious exercise.
Collaboration Enhances Insights
Features that support teamwork, such as real-time editing and sharing, foster collaboration and innovation among team members.
Moreover, look for software that supports advanced analytics, such as predictive modeling or trend analysis. These capabilities can empower users to make data-driven decisions that propel their business forward. In a world where informed decisions are critical, having these analysis tools at your fingertips is invaluable.
Collaboration Features for Team Efforts
In today’s collaborative work environment, having features that support teamwork is essential. Data visualization software should allow multiple users to work on the same project simultaneously, fostering a collaborative atmosphere. This feature is like having a digital whiteboard where everyone can contribute their ideas and insights in real-time.
Consider tools that enable commenting and sharing visualizations effortlessly. This allows team members to provide feedback, ask questions, and refine visuals together. When everyone can see and interact with the data, it encourages discussion and innovation.
Additionally, look for options that make it easy to share visualizations externally, such as through email or social media. This capability helps to disseminate information quickly and effectively, engaging broader audiences. In essence, collaboration features can turn individual efforts into team triumphs.
Mobile Accessibility for On-the-Go Insights
As we become increasingly mobile, having data visualization software that is accessible on various devices is a must. Whether you’re in the office or on the go, you should be able to access your data and visualizations at any time. This flexibility is akin to having your office in your pocket.
Look for software that offers responsive designs or dedicated mobile applications. This ensures that visuals are easy to view and interact with, regardless of screen size. Being able to present findings during a meeting or check metrics while traveling can significantly enhance productivity.
Security is Essential for Data Safety
Robust security features protect sensitive data from unauthorized access and ensure peace of mind in a digital landscape.
Moreover, mobile accessibility can facilitate real-time decision-making. Imagine being at a conference and needing to provide insights instantly; having mobile access allows you to respond to queries on the spot. This feature empowers users to stay informed and agile in fast-paced environments.
Security Features to Protect Your Data
Data security is a growing concern in our digital landscape, making it essential to consider security features in data visualization software. Sensitive data must be protected from unauthorized access, breaches, or leaks. Think of it as locking your front door; it’s a crucial step to ensure your valuable information stays safe.
Check for features like encryption, user authentication, and access controls. These layers of security help safeguard your data and ensure that only authorized personnel can view or modify it. Without these protections, your valuable insights could be at risk.

Additionally, consider how the software handles data backups and recovery. In the event of a technical failure or cyber incident, having a reliable backup system can save you from significant losses. Prioritizing security features is not just about compliance; it’s about peace of mind.
Affordability and Value for Your Investment
Last but certainly not least, affordability and overall value are crucial when choosing data visualization software. It’s important to weigh the software’s features against its cost to ensure you’re making a wise investment. Picture this: you find a powerful tool, but its price tag leaves your budget in shambles.
Look for flexible pricing models that accommodate different needs and budgets. Subscription plans, one-time purchases, or tiered pricing can provide options that fit your organization’s financial situation. This flexibility can make high-quality software accessible to businesses of all sizes.
Finally, consider the return on investment (ROI) the software might offer. If it streamlines processes, enhances productivity, and leads to better decision-making, the long-term benefits can outweigh the initial costs significantly. Ultimately, finding a balance between affordability and value will set you up for success.